Introduction of Candlestick patterns
Forex trading is dynamic and potentially money-making, but it can also be overwhelming for beginners. Understanding and effectively utilizing candlestick patterns is a crucial skill for successful trading. In this article, You will understand the basics of candlestick patterns, At the end of the section have a step-by-step explanation, clear examples, and strategies for entry and exit.
Understanding Candlestick Patterns
Candlestick charts are a popular tool in technical analysis, offering valuable insights into market sentiment. Each candlestick represents price movement during a specific time period.
Typically displayed in different colors for easy identification:
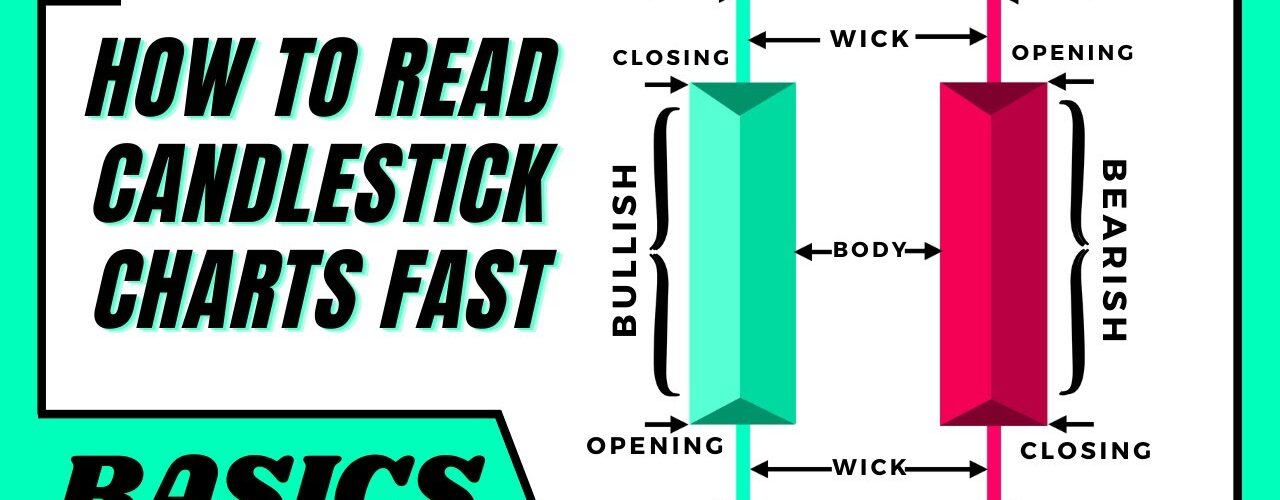
- Bullish Candlestick: Typically green or white, this candlestick indicates that the closing price is higher than the opening price. It suggests a bullish or upward market sentiment.
- Bearish Candlestick: Usually red or black, this candlestick signifies that the closing price is lower than the opening price. It implies a bearish or downward market sentiment.
Anatomy of a Candlestick
Let’s break down the components of a candlestick:
– Opening Price: The price at which the market opens during the given time period.
– Closing Price: The price at which the market closes during the same period.
– High: During the period the price reached the highest.
– Low: During the period the price reached the lowest.
Common Candlestick Patterns
Now, let’s delve into some common candlestick patterns that can assist in your trading decisions:
- Doji:
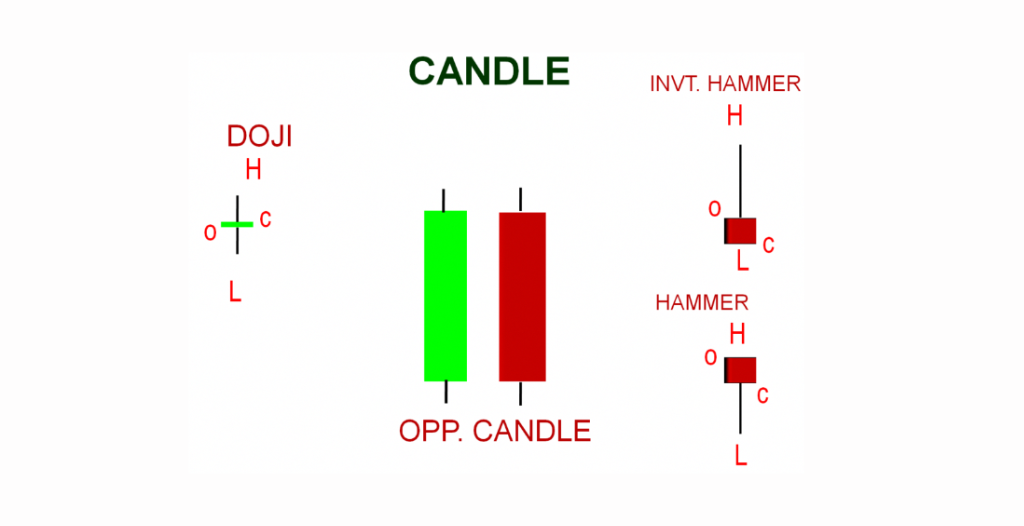
– Description: A Doji has the same opening and closing prices, often indicating market indecision. It can signify a potential reversal when it appears after a strong trend.
- Hammer:
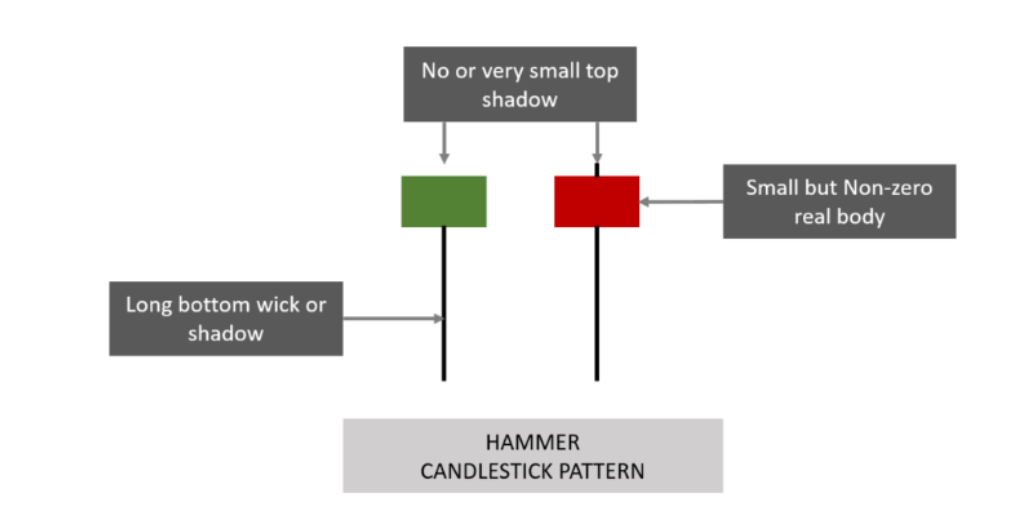
– Description: A Hammer has a small body with a long lower shadow, suggesting that buyers have started to gain control after a bearish trend. It can be an indication of a bullish reversal.
- Shooting Star:
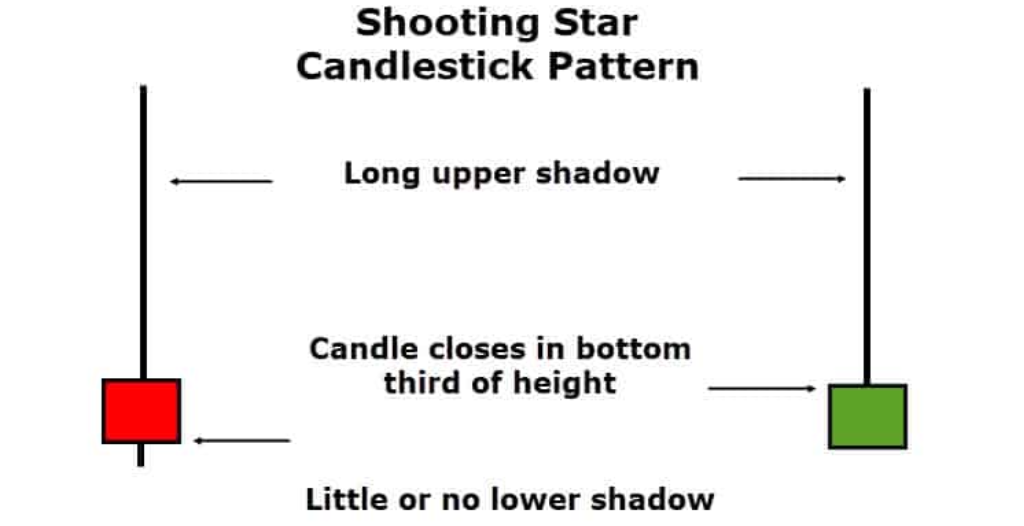
– Description: A Shooting Star has a small body with a long upper shadow, signaling potential weakness in an uptrend. It can be a bearish reversal indicator.
- Engulfing Pattern:
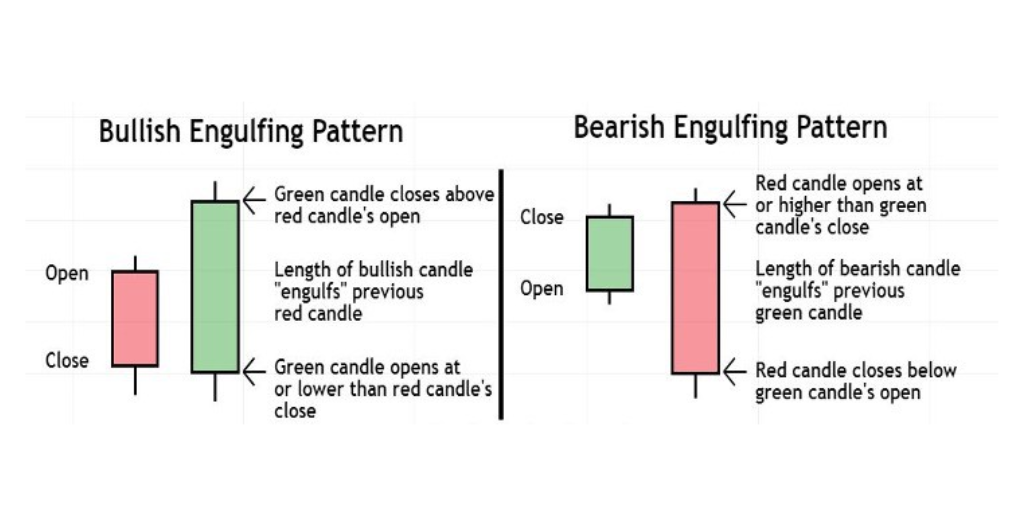
– Description: An Engulfing Pattern consists of two candlesticks where the second one completely engulfs the first. A Bullish Engulfing Pattern occurs after a downtrend and can indicate a bullish reversal, while a Bearish Engulfing Pattern after an uptrend may suggest a bearish reversal.
Entry and Exit Strategies
Entry Strategies:
- Bullish Engulfing Entry:
– Identify a Bearish trend.
– Wait for a Bearish Engulfing Pattern to form.
– Enter a long position (buy) at the opening price of the candlestick following the Bullish Engulfing Pattern.
- Hammer Entry:
– Recognize a Bearish trend.
– Look for a Hammer candlestick.
– Enter a long position at the opening price of the candlestick following the Hammer.
Exit Strategies:
- Take Profit:
– Determine a predefined profit target based on technical analysis or risk-reward ratio.
– When the price reaches this target, close the trade to secure your profits.
- Stop Loss:
– Set a stop-loss order to limit potential losses.
– Place it below the low of the candlestick that prompted your entry for long positions.
Real-Life Examples:
Let’s illustrate these strategies with real-life examples:
Example 1: Bullish Engulfing Entry
– Situation: Market in a downtrend.
– Action: Bullish Engulfing Pattern appears.
– Entry: Buy at the opening price of the candle following the Bullish Engulfing Pattern.
– Exit: Set a Take Profit level, and close the trade when reached.
Example 2: Hammer Entry
– Situation: Market in a downtrend.
– Action: Hammer candlestick forms.
– Entry: Buy at the opening price of the candle following the Hammer.
– Exit: Implement a Stop Loss order below the low of the Hammer candle for risk management.
Risk Management and Additional Tips
- Risk Management:
– Don’t trade without a Stop Loss.
– Always use proper position sizing to limit losses.
– Understand your portfolio to spread risk.
- Continuous Learning:
– Always updated with economic events and market news.
– Keep practicing with demo accounts before using real money.
- Combine with Other Indicators:
– Use candlestick patterns in conjunction with other technical indicators like Moving Averages and Relative Strength Index (RSI) for better confirmation.
Conclusion
Mastering candlestick patterns is a vital step for beginners in the world of Forex trading. Now you will understand the common patterns and implement effective entry and exit strategies, you should practice and gain your trading skills and be a successful trader.
Don’t forget practice and continuous learning are key to becoming a proficient Forex trader.
Read this Article: Powerful Basic Keys Points of Technical Analysis in Forex Trading



Add comment